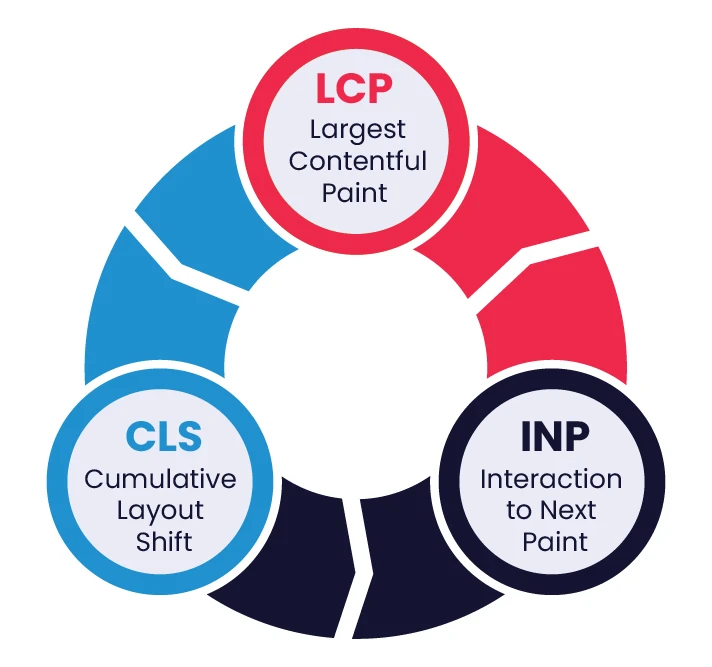
Google's three Core Web Vitals in 2026 are: LCP (Largest Contentful Paint) — good score under 2.5s; CLS (Cumulative Layout Shift) — good score under 0.1; INP (Interaction to Next Paint) — good score under 200ms. Note: INP replaced FID (First Input Delay) in March 2024.
Page speed has always been important — but in 2026, Google's Core Web Vitals have become one of the most measurable, actionable sets of ranking signals available to SEOs and developers. They're not abstract guidelines — they're precise, scored metrics that Google uses to evaluate the real-world experience users have on your pages.
Whether you're a technical SEO, a developer, or a site owner trying to understand why your pages are underperforming, leveraging technical SEO services can help you identify and fix performance issues faster. this guide covers everything: what the Core Web Vitals are, what changed with the INP update, how to measure your scores, and — most importantly — how to fix every metric with actionable, step-by-step solutions.
What Are Core Web Vitals?
Core Web Vitals are a set of three specific user experience metrics defined by Google to measure the loading performance, visual stability, and interaction responsiveness of a webpage. Introduced as part of Google's Page Experience update, they became an official ranking signal in 2021 and have grown in importance every year since.
Unlike vanity metrics such as total page size or number of requests, Core Web Vitals measure what users actually experience — how fast the main content loads, whether the page jumps around unexpectedly, and how quickly the page responds when a user interacts with it. Google's position is clear: pages that deliver a better user experience deserve to rank higher.
Where are Core Web Vitals measured?
- Google Search Console (CWV Report): Provides information about the field of actual Chrome visitors to your site. Dividing into URL group, mobile and desktop, and Good / Needs Improvement / Poor.
- PageSpeed Insights: Combines field data (from the Chrome UX Report) with lab data from Lighthouse. Provides a performance score and individual CWV metrics by URL.
- Chrome DevTools & Lighthouse: Testing tools, lab-based testing of specific pages in a controlled environment. Ideal for identifying particular problems in the development.
- Chrome UX Report (CrUX): Google's list of actual performance information gathered on its Chrome users who have provided their consent. Field data on the source of truth of field data in GSC and PageSpeed Insights.
What Changed in 2026: The INP Update
The biggest shift in Core Web Vitals in recent memory happened on March 12, 2024, when Google officially retired FID (First Input Delay) and replaced it with INP (Interaction to Next Paint). As we move through 2026, INP is now fully embedded as a ranking signal — and many sites are still struggling to meet its thresholds.
FID vs INP — What's the Difference?
FID measured only the delay before the browser began processing a user's first interaction — typically a click or tap. It didn't measure how long that interaction took to complete. This meant a page could pass FID while still feeling sluggish and unresponsive to users.
INP is a measurement of the entire page responsiveness of a page during the entire visit and not merely in the initial intercourse. It measures the latency of all eligible interactions (taps, clicks, keyboard, etc.) and gives the worst interactive time. A page with a good INP score feels fast and responsive to all user input, not only the initial one.
| Metric |
What It Measured
|
Threshold
|
Status |
|
FID (First Input Delay)
|
Delay before browser processes first input
|
Good: < 100ms
|
Retired March 2024
|
|
INP (Interaction to Next Paint)
|
Full responsiveness of all interactions
|
Good: < 200ms
|
Active — 2026 ranking signal
|
Why does this change matter? Sites that passed FID comfortably may now fail INP — because INP is a stricter, more comprehensive measure of responsiveness. Any site with heavy JavaScript, complex event handlers, or third-party scripts is at risk. Auditing your INP score should be a top priority for any technical SEO in 2026.
The 3 Core Web Vitals Explained
LCP — Largest Contentful Paint
LCP measures how long it takes for the largest visible element on the page — typically a hero image, banner, or large block of text — to fully load and render in the viewport. It is an essential indicator of the perceived loading speed according to the user of Google.
Good score: Under 2.5 seconds. Needs Improvement: 2.5s–4.0s. Poor: Over 4.0 seconds.
Common causes of poor LCP:
- Poor server response in terms of time to first byte (high TTFB — Time to First Byte)
- Massive and uncompressed hero images were used in heredity versions (JPEG, PNG).
- JavaScript or CSS that blocks page rendering.
- No preloading of the LCP image — browser discovers it too late
- No CDN, which makes users in far parts of the world have high latency.
CLS — Cumulative Layout Shift
CLS, or Cumulative Layout Shift, is a metric that gauges a webpage's visual stability. It zeroes in on how much the layout unexpectedly moves around while the page is loading. Each time an element shifts after it's appeared on the screen, it adds to the CLS score. A high score indicates that users are seeing content jump around, which can cause accidental clicks, make it hard to keep reading, and generally be pretty annoying.
Good score: Under 0.1. Needs Improvement: 0.1–0.25. Poor: Over 0.25.
Common causes of poor CLS:
- Pictures and video embeds do not have width and height attributes in the HTML.
- Inserts, banners, or iframes that are placed in the page without a reserved space.
- Web fonts that produce a flash of unstyled text (FOUT), which moves around the content.
- Dynamically loaded custom content (banners, cookie notice, pop-ups) added on top of pre-existing content once loaded.
- Loading third-party widgets at the bottom of the page
INP — Interaction to Next Paint
INP measures the responsiveness of a page to user interactions throughout the entire visit. It measures the duration between the time a user triggers an interaction (a click, tap, or the press of a key) and the time the browser requires to paint the next frame in response. INP, unlike FID, assesses every interaction, not just the initial one. This gives it a much more precise picture of how responsive a page truly is.
A good score? Under 200 milliseconds.
Needs Improvement: 200ms–500ms. Poor: Over 500ms.
Common causes of poor INP:
- Large JavaScript processes that hang the primary thread when users interact.
- Intensive event handlers that cause complicated updates or recalculations to the DOM.
- Third-party scripts (chat widgets, analytics, ad scripts) on the main thread.
- DOM overflow is causing slow rendering changes.
- React or other framework re-renders caused by simple interactions without being optimized.
Core Web Vitals Score Reference
| Metric |
Good |
Needs Improvement
|
Poor |
|
LCP (Largest Contentful Paint)
|
< 2.5s
|
2.5s – 4.0s
|
> 4.0s
|
|
CLS (Cumulative Layout Shift)
|
< 0.1
|
0.1 – 0.25
|
> 0.25
|
|
INP (Interaction to Next Paint)
|
< 200ms
|
200ms – 500ms
|
> 500ms
|
How to Measure Your Core Web Vitals
Before you fix your Core Web Vitals scores, you need to know exactly where you stand — and using the right website audit tools can make this process much more accurate and efficient.” The tools do not all work the same way, and it is necessary to know how to distinguish field data and lab data.
Field Data vs Lab Data
Field data (sometimes referred to as Real User Monitoring or RUM) is the actual performance of real users on your site, under real-life conditions, actual devices, network conditions, and the real world. This is the data Google uses for ranking. Sources: Google Search Console, Chrome UX Report (CrUX), PageSpeed Insights (field section).
Lab data is used to simulate page load in controlled conditions. It is very consistent and good at diagnosing and testing fixes, but not what real users experience. Sources: Lighthouse, Chrome DevTools, PageSpeed Insights (lab section).
Key rule: Always prioritise fixing issues flagged in field data (GSC and CrUX) first. Lab data is your diagnostic tool — field data is your ranking signal.
Google Search Console — CWV Report
The Core Web Vitals report in GSC is your most important starting point. It shows URL groups categorised as Good, Needs Improvement, or Poor — based on field data from real Chrome users. It separates mobile and desktop data and identifies which specific metric is causing the issue per URL group. Check this report first.
PageSpeed Insights
Enter any URL at pagespeed.web.dev to get both field data (if available in CrUX) and lab data in one view. The Diagnostics section shows specific issues affecting each Core Web Vital — making it ideal for per-page auditing. Mobile scores and desktop scores are usually very different, making mobile SEO optimization critical for performance. so always check both of them.
Chrome DevTools & Lighthouse
Diagnose Chrome Devtools Performance panel and Lighthouse audits right in your browser. These are essential for identifying long tasks affecting INP, render-blocking resources hurting LCP, and layout shift contributors for CLS. Most applicable in the development process or when testing a particular page.
Chrome UX Report (CrUX)
CrUX is the public performance data set provided by Google, which is a collection of real-world performance data of users who have opted in to Chrome. It is the source of the underlying data of the GSC and PageSpeed Insights field data. You may ask CrUX questions directly, either through the CrUX API or through BigQuery, to further analyze large sets of URLs - especially relevant to the enterprise level of SEO audits.
How to Fix LCP (Largest Contentful Paint)
Poor LCP is the most common Core Web Vitals failure across all site types. The positive side: it is also the easiest to cure using the appropriate technical interventions.
1. Optimise the Largest Image
Identify your LCP element using PageSpeed Insights or Chrome DevTools (look for the element labelled 'LCP' in the performance timeline). If it's an image
- Save as WebP or AVIF - they will be 25500 smaller than JPEG/PNG and equally or even better quality.
- Use the Squoosh, ImageOptim, or server-based image sharpening with Sharp to truncate the image.
- Use width and height to prevent a change of layout on loading.
- Add fetchpriority = "high" to the LCP image tag to instruct the browser to load it immediately
2. Preload the LCP Resource
If the LCP element is an image (especially a CSS background image or lazy-loaded image), the browser may discover it late in the loading process. Include a <link rel="preload"> tag in the <head> to force early discovery:
<link rel="preload" as="image" href="/hero-image.webp" fetchpriority="high">
3. Minimize Server Response Time (TTFB).
A slow Time to First Byte (TTFB) directly delays LCP — the browser can't render content it hasn't received yet. To improve TTFB:
- Switch to a better hosting or upgrade to a faster host.
- Use server-side caching (Redis, Varnish, or full-page caching WordPress plugins)
- Open HTTP/2 or HTTP/3 on your server so that it can multiplex connections.
- Reduce dynamic page query time on databases.
4. Eliminate Render-Blocking Resources
Synchronous JavaScript and CSS files (under the <head> block) prevent the browser from proceeding until they are completely downloaded and executed. Fixes:
- Add the attributes defer or async to non-crucial JavaScript files.
- Move non-critical CSS to load asynchronously or inline critical CSS directly in the <head>
- Delete dead code CSS and JavaScript with PurgeCSS or tree-shaking in your build.
5. Deploy a CDN
A Content Delivery Network (CDN) leverages your statics, images, CSS, JS, etc., off edge servers located geographically near the user. This drastically minimizes the latency of users who are distant from your origin server. Cloudflare, Fastly, AWS CloudFront, and BunnyCDN are some of the recommended CDNs to use where cost-effective delivery is required across the globe.
How to Fix CLS (Cumulative Layout Shift)
CLS issues are often introduced by developers or content editors without realising it. The fixes are usually straightforward — but require consistent application across all page templates and content types.
1. Always Set Width and Height on Images and Embeds
The single most common cause of CLS is images without explicit dimensions. When a browser loads an image without knowing its size, it renders the page without the image space, then shifts everything down when the image loads. Fix:
- Add width and height attributes to every <img> tag: <img src="hero.webp" width="1200" height="630" alt="...">
- Use CSS aspect-ratio to reserve space for responsive images and video embeds
- For video iframes, wrap in a container with a fixed aspect-ratio padding-bottom technique or the modern CSS aspect-ratio: 16/9 property
2. Reserve Space for Ads and Iframes
Ads and third-party iframes are among the most frequent sources of unexpected layout shifts — because their dimensions are often unknown until the content loads. Best practice:
- Always define a minimum height container for ad slots, even before the ad loads
- Use CSS to pre-allocate the exact space the ad unit will occupy
- Avoid placing ad units directly above visible content where a shift would be most disruptive
3. Avoid Inserting Content Above Existing Content
Cookie consent banners, notification bars, promotional pop-ins, and dynamically injected headers that appear after initial page load are major CLS contributors. Fix: load these elements as overlays (fixed or sticky positioning) rather than inline elements that push content down. If they must be inline, reserve their exact space in the initial HTML.
4. Optimise Font Loading Strategy
Web fonts can trigger CLS. This occurs when a fallback font is swapped out for the web font after the latter has finished loading, leading to a Flash of Unstyled Text, or FOUT. Consequently, the text reflows, and the layout adjusts.
- Use font-display: optional for non-essential fonts can effectively eliminate the flash of unstyled text (FOUT).
- Use font-display: swap` with `size-adjust` and `ascent-override` is a good strategy to maintain visual consistency.
- Preload your critical web fonts with a tag like this: <link rel="preload" as="font" href="/font.woff2" crossorigin>.
How to Fix INP (Interaction to Next Paint)
INP is the newest and often most technically challenging Core Web Vital to fix. Poor INP is almost always caused by excessive JavaScript execution on the main thread. Here's how to address it systematically.
1. Reduce JavaScript Execution Time
Heavy JavaScript is the root cause of most INP failures. As the prime thread is occupied with the execution of the JS, it is unable to react to user interactions. Audit
Audit your JS with the Chrome DevTools, in the Coverage panel, to see any unused code, and with tools such as Webpack Bundle Analyzer or the rollup-plugin-visualizer in Vite to see large bundles.
- Remove unused JavaScript libraries and replace heavy dependencies with lightweight alternatives
- Code-split your JavaScript bundles so only the code needed for the current page loads initially
- Defer non-critical scripts using defer or dynamic import()
2. Break Up Long Tasks
Any JavaScript task taking over 50ms to run on the main thread is considered a long task. Long tasks block the browser from responding to user input, directly worsening INP. To break them up:
- Use setTimeout(fn, 0) or scheduler.postTask() to yield control back to the browser between chunks of work
- Break large data processing operations into smaller chunks using requestAnimationFrame or requestIdleCallback
- Use the isInputPending() API to check if a user interaction is waiting and yield immediately if so
3. Use Web Workers
JavaScript on the Web Workers is virtually sandboxed in a separate thread, independent of the main thread in every way. This is best used in the case of heavy computations such as information parsing, image processing, complicated calculations, etc., that would otherwise clog user interactions. Web workers are also best suited to pure computations where the results are fed back to the main thread because they do not have access to the DOM.
4. Minimise Third-Party Scripts
Third-party scripts — live chat widgets, analytics platforms, A/B testing tools, ad scripts — are among the biggest contributors to poor INP because they run on the main thread and often execute long tasks unpredictably. Fixes::
- Check every third-party script using the Third-party Summary area in Lighthouse.
- Load non-essential third-party scripts with defer or only after user interaction (facade pattern for live chat widgets)
- Where feasible, swap out resource-intensive analytics scripts for lighter alternatives (think Plausible instead of a Google Tag Manager-heavy setup).
5. Optimise Event Handlers
Unfriendly event handlers, which are activated every time a key is struck, a scroll or a mouse wheel is scrolled, and so on, can result in repetitive and time-consuming behaviors. This, in turn, can seriously hurt your INP scores.
Here are some suggestions:
- Limit the frequency of event handlers that trigger often, such as those for scrolling, resizing, or input.
- Avoid causing layout or style recalculations in event handlers (e.g., by reading layout properties such as offsetWidth or offsetHeight, or by modifying style properties directly).
- Do not read layout properties such as offsetHeight immediately after setting the DOM.
- Make use of event delegation: Add one event listener to a parent object, rather than many event listeners to child objects.
Core Web Vitals for Different Page Types
Not all pages have the same Core Web Vitals profile. This information will save your time by letting you know which issues are most prevalent on a per-page basis and thus focus on fixing those issues better.
|
Page Type
|
Most Common CWV Issue
|
Primary Cause
|
Priority Fix
|
|
Blog Posts
|
LCP
|
Large unoptimised hero images, render-blocking fonts
|
Convert to WebP, preload LCP image, optimise fonts
|
|
Product Pages
|
CLS + LCP
|
Late-loading product images, injected review widgets, ad slots
|
Set image dimensions, reserve ad space, lazy-load below-fold |
|
Landing Pages
|
LCP + INP
|
Heavy above-fold images, JavaScript-heavy form interactions
|
Preload hero image, defer JS, optimise form event handlers
|
|
Category/Listing Pages
|
CLS + INP
|
Dynamic product loading, filter interactions with heavy JS
|
Skeleton screens, break up filter JS, reduce DOM size
|
|
Checkout Pages
|
INP |
Complex form validation JS, third-party payment widgets
|
Optimise validation handlers, facade payment widgets
|
| Homepage |
LCP + CLS
|
Large hero banners, notification bars, auto-playing sliders
|
Optimise hero image, fix slider CLS, defer notification bars
|
Key insight: Blog posts and homepages most commonly fail LCP as they have image issues. Also, product and category pages tend to struggle most with CLS from dynamic content loading. Whereas INP failures are concentrated on pages that have heavy JavaScript interactions, checkouts, landing pages with forms, and filter-heavy listing pages.
Final Thoughts: Making Core Web Vitals a Development Standard
By 2026, Core Web Vitals won't just be a nice-to-have; they'll be a fundamental element of Google's ranking system, a real measure of how well a site serves its users. With INP now in the mix, the stakes have been raised. Websites are now compelled to look beyond basic image tweaks and dig into the intricacies of JavaScript performance.
The most effective approach is to integrate Core Web Vitals monitoring into your development workflow — not just as a pre-launch checklist item. Set up regular GSC audits, run Lighthouse on every significant deployment, and treat CWV regressions as bugs rather than optimisation backlog items.
Start with the metrics failing in your Google Search Console Core Web Vitals report. Fix LCP first if you have slow-loading pages, CLS if your layouts shift, and INP if your interactions feel unresponsive. Apply the fixes systematically by page type, monitor your GSC report over 4–6 weeks, and document what moved the needle — because what works on one site type may differ from another.
If you want to implement these fixes without the trial and error, W3era’s SEO services can help you improve Core Web Vitals and overall search performance.